php扩展xdebug基本使用
发布日期:2021-06-30 19:28:52
浏览次数:5
分类:技术文章
本文共 2275 字,大约阅读时间需要 7 分钟。
官网:
使用:
安装
使用
1.获取文件名,行号,函数名
xdebug_call_class()
<?php
function fix_string($a) { echo "Called @ ". xdebug_call_file(). ":". xdebug_call_line(). " from ". xdebug_call_function(); } $ret = fix_string(array('Derick'));?> 输出:Called @ /var/www/xdebug_caller.php:12 from {main} 2.输出head信息
xdebug_get_headers()
输出:
array(2) { [0]=> string(6) "X-Test" [1]=> string(33) "Set-Cookie: TestCookie=test-value"}
3.输出执行时间
xdebug_time_index()
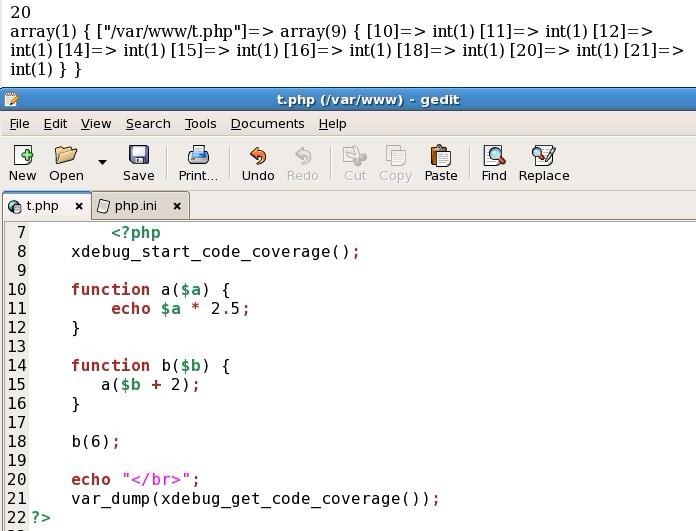
4.代码覆盖
xdebug_start_code_coverage();代码
var_dump(xdebug_get_code_coverage());
看图更明显
5.代码跟踪
需要跟踪的代码:
class myClass{ public function a($a) { echo $a * 2.5; } public function b($b) { $this->a($b + 2); }}xdebug_start_trace('trace');$obj=new myClass();$obj->b(6);echo "";xdebug_stop_trace(); --------------------------------------------------------------------------
xdebug配置参考xdebug.default_enable = Onxdebug.show_exception_trace = Onxdebug.show_local_vars = 1xdebug.max_nesting_level = 50xdebug.var_display_max_depth = 6xdebug.dump_once = Onxdebug.dump_globals = Onxdebug.dump_undefined = Onxdebug.dump.REQUEST = *xdebug.dump.SERVER = REQUEST_METHOD,REQUEST_URI,HTTP_USER_AGENTxdebug.trace_format = 0xdebug.auto_trace = Onxdebug.trace_output_dir = E:\xampp\tmp\tracesxdebug.trace_output_name = trace.%c.%pxdebug.collect_params = 4xdebug.collect_includes = Onxdebug.collect_return = Onxdebug.show_mem_delta = On
设置xdebug.auto_trace = Off可在代码中添加xdebug_start_trace();xdebug_stop_trace();语句生成追踪文件。
使用xdebug_start_trace跟踪代码执行xdebug_start_trace('trace');$a->myCaller($b);xdebug_stop_trace();TRACE START [16:53:57]0.0010 57964 -> MyClass->myCaller() /code/xdebug.php:210.0011 58104 -> MyOther->myCallee() /code/xdebug.php:40.0011 58104 -> xdebug_call_class() /code/xdebug.php:100.0011 58128 -> printf() /code/xdebug.php:100.0014 58196 -> xdebug_call_function() /code/xdebug.php:110.0015 58196 -> printf() /code/xdebug.php:110.0016 58196 -> xdebug_call_file() /code/xdebug.php:120.0016 58244 -> printf() /code/xdebug.php:120.0017 58244 -> xdebug_call_line() /code/xdebug.php:130.0017 58244 -> printf() /code/xdebug.php:130.0018 58244 -> xdebug_stop_trace() /code/xdebug.php:220.0019 58244TRACE END [16:53:57] 转载地址:https://linuxstyle.blog.csdn.net/article/details/7047191 如侵犯您的版权,请留言回复原文章的地址,我们会给您删除此文章,给您带来不便请您谅解!
发表评论
最新留言
路过按个爪印,很不错,赞一个!
[***.219.124.196]2024年04月07日 01时25分46秒
关于作者

喝酒易醉,品茶养心,人生如梦,品茶悟道,何以解忧?唯有杜康!
-- 愿君每日到此一游!
推荐文章
Python 之 histogram直方图
2019-04-30
Python 之 Scatter散点图
2019-04-30
Python实现决策树 Desision Tree & 可视化
2019-04-30
决策树 Decision tree
2019-04-30
nominal和ordinal & 数据处理中四种基本数据类型
2019-04-30
Python 实现 Cross-validation
2019-04-30
Grid SearchCV(网格搜索)& Python实现
2019-04-30
ROS相关知识
2019-04-30
单目深度估计 monodepth2模型 代码
2019-04-30
位图索引Bitmap indexes
2019-04-30
YOLO算法(二)—— Yolov2 & yolo9000
2019-04-30
YOLO算法(三)—— Yolov3 & Yolo系列网络优缺点
2019-04-30
Python的__future__模块
2019-04-30
计算机视觉中的cost-volume的概念具体指什么(代价体积)
2019-04-30
白红宇的个人博客 - 记录点点滴滴的事 - 您是第 310876428 位访客
访问时间: 2024-05-04 23:44:58
访问IP: 3.144.252.201
Copyright © 2020 - 2023 blog.css8.cn 京ICP备2021015314号-1
手机版